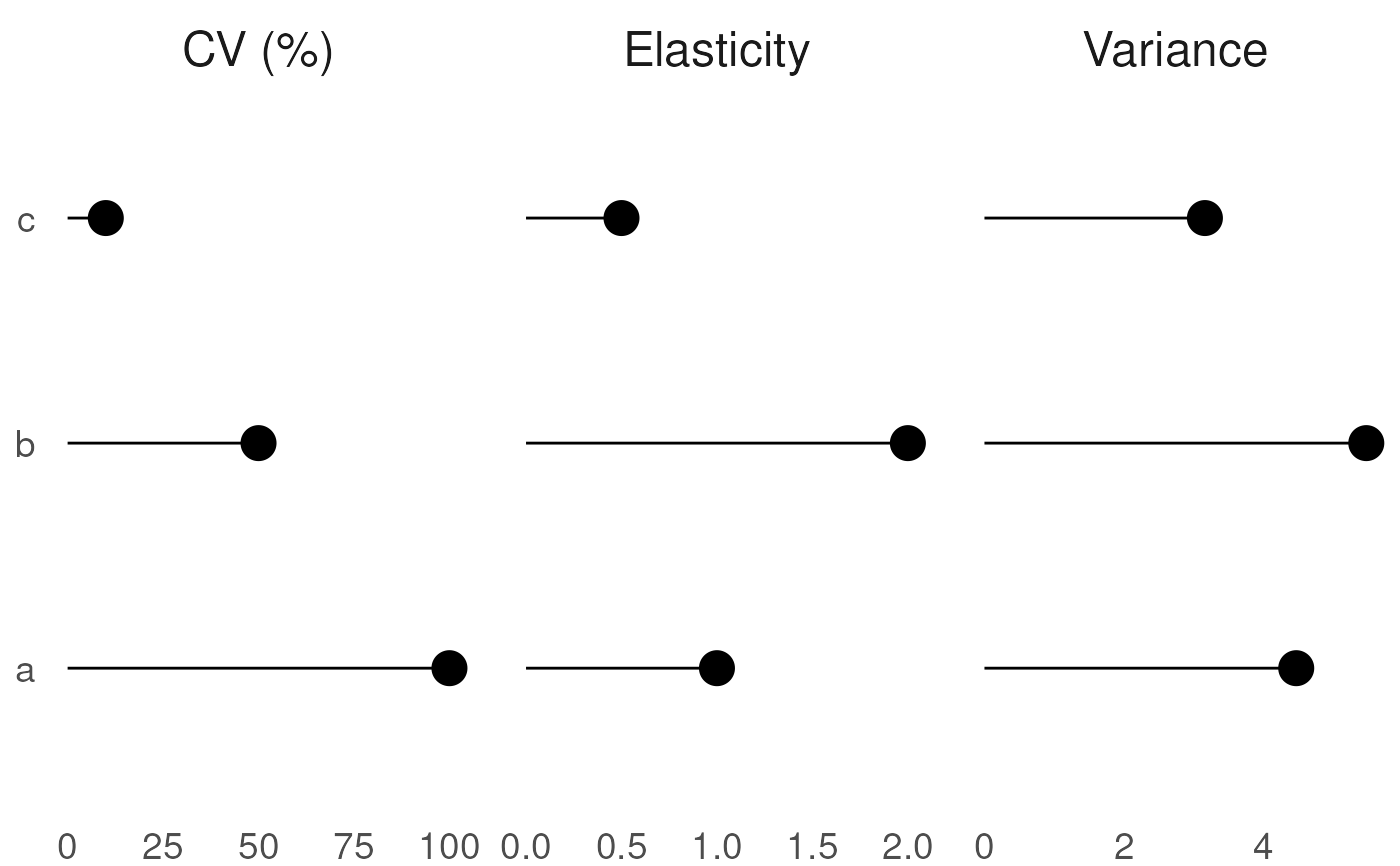
Plots variance decomposition tryptich: CV, elasticity, variance
Usage
plot_variance_decomposition(
  plot.inputs,
  fontsize = list(title = 18, axis = 14),
  order_by = c("Variance", "Elasticity", "CV (%)", "rowname", "none")
)
Arguments
- plot.inputs
Output from a sensitivity analysis. Output must be of the form
given by sensitivity.results$variance.decomposition.output in model output
- fontsize
list specifying the font size of the titles and axes of the graph
- order_by
Result column to sort by, or "none" to retain input order
Author
David LeBauer, Carl Davidson, Chris Black
Examples
x <- list(trait.labels = c('a', 'b', 'c'),
coef.vars = c(a=1,b=0.5, c=0.1),
elasticities = c(a=1,b=2,c=0.5),
variances = c(a = 20, b=30, c = 10))
plot_variance_decomposition(x)
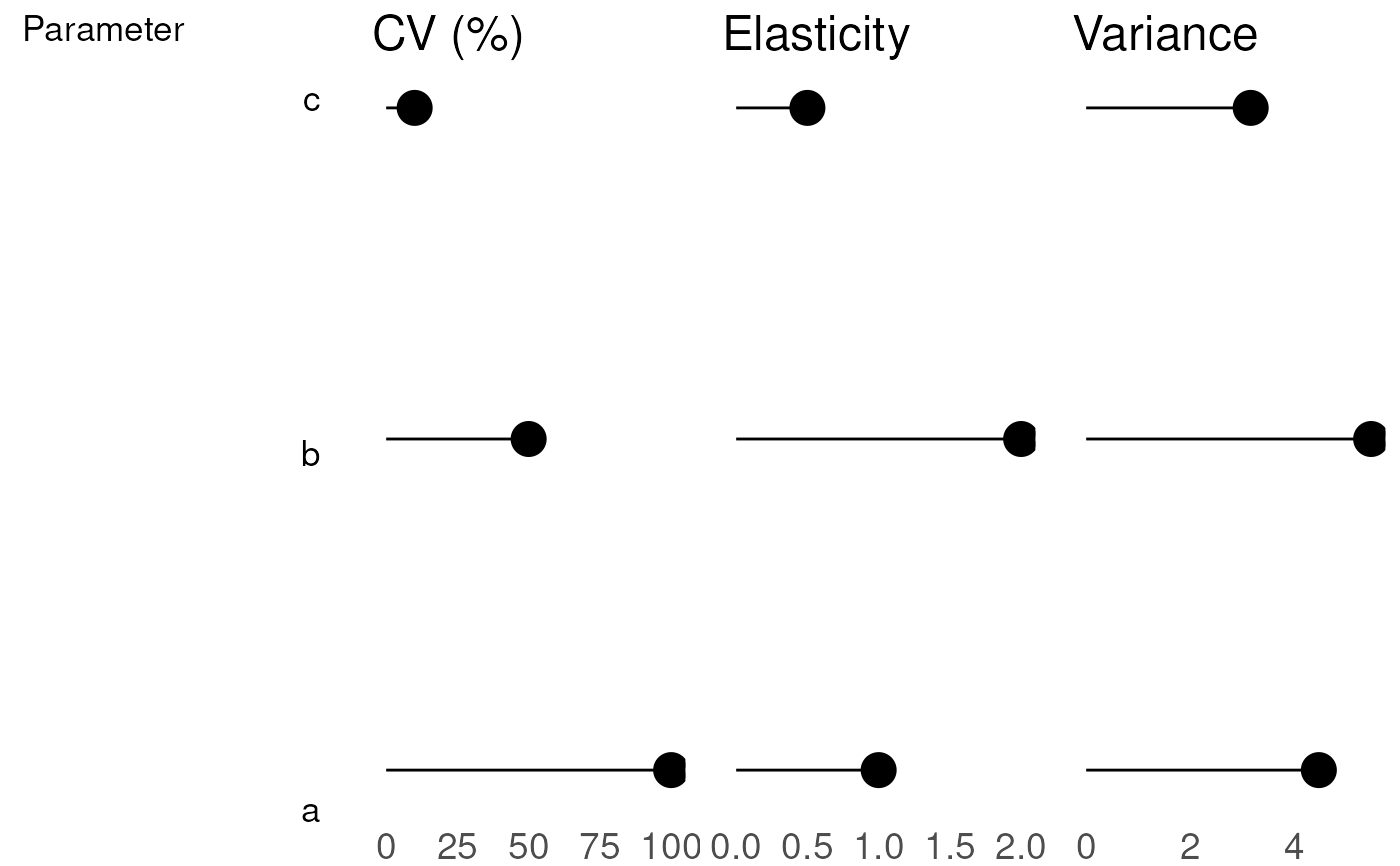 plot_variance_decomposition(x, order_by = "rowname")